What Does 24/7 Phone Coverage Cost In-House? A State-by-State Ranking (2026)
Covering the phones around the clock with in-house receptionists costs between about $135,059 and $193,590 a year in wages alone, depending on the state — and $211,935 in Washington, D.C. The U.S. average works out to roughly $165,722. That is before payroll taxes, benefits, training, or shift differentials. This ranking uses official Bureau of Labor Statistics wage data to show what round-the-clock coverage costs in every state.
How We Calculated 24/7 Coverage Cost by State
A week has 168 hours. One full-time receptionist works about 40 of them, so round-the-clock coverage needs roughly 4.2 full-time employees. We multiplied each state’s average hourly wage for receptionists and information clerks by the 8,736 hours in a year of continuous coverage (168 hours × 52 weeks). The wage data is from the BLS Occupational Employment and Wage Statistics program, May 2025 estimates for Receptionists and Information Clerks (SOC 43-4171), the most recent release available.
- Included: average wages only.
- Not included: employer payroll taxes (7.65% for Social Security and Medicare on top of wages), benefits, paid time off, recruiting, training, turnover, or overnight and weekend pay differentials. Real costs run higher.
- Comparison column: the difference from $61,152 a year, which is what 24/7 coverage costs at OnCalla’s $7-per-hour starting rate for a dedicated agent (168 hours × 52 weeks). Actual pricing depends on your plan — see our pricing page.
Key Findings
- The range is wide. Round-the-clock in-house coverage costs about $58,531 more a year in California than in Mississippi, on wages alone.
- Nationally, it’s about $165,722 a year. 18 of the 51 jurisdictions come in above that average.
- Every state costs more than double the starting rate. Even the lowest-cost state, Mississippi, is $73,907 above the $61,152 starting-rate figure.
- Washington, D.C. is the highest at $211,935. The most expensive state is California at $193,590.
The 10 Most Expensive States (and D.C.) for 24/7 In-House Coverage
- Washington, D.C. — $211,935 a year
- California — $193,590 a year
- Washington — $191,930 a year
- New York — $188,348 a year
- Alaska — $188,261 a year
- Massachusetts — $184,592 a year
- Hawaii — $182,408 a year
- Connecticut — $180,398 a year
- New Jersey — $180,398 a year
- Maine — $179,612 a year
The 10 Least Expensive States
- Mississippi — $135,059 a year
- Alabama — $136,718 a year
- Louisiana — $137,767 a year
- West Virginia — $138,466 a year
- Kentucky — $141,785 a year
- Oklahoma — $142,834 a year
- Arkansas — $146,328 a year
- New Mexico — $147,638 a year
- Tennessee — $148,337 a year
- South Carolina — $148,425 a year
Receptionist Pay by State: Full Ranking
All 50 states and D.C., ranked from highest to lowest 24/7 coverage cost. Each state name links to our page for that state. Download this table as a CSV — free to use with attribution.
| Rank | State | Avg. hourly wage | One receptionist, per year | 24/7 in-house wages, per year | Difference vs. $61,152 |
|---|---|---|---|---|---|
| 1 | Washington, D.C. | $24.26 | $50,450 | $211,935 | $150,783 |
| 2 | California | $22.16 | $46,100 | $193,590 | $132,438 |
| 3 | Washington | $21.97 | $45,690 | $191,930 | $130,778 |
| 4 | New York | $21.56 | $44,840 | $188,348 | $127,196 |
| 5 | Alaska | $21.55 | $44,820 | $188,261 | $127,109 |
| 6 | Massachusetts | $21.13 | $43,950 | $184,592 | $123,440 |
| 7 | Hawaii | $20.88 | $43,430 | $182,408 | $121,256 |
| 8 | Connecticut | $20.65 | $42,960 | $180,398 | $119,246 |
| 9 | New Jersey | $20.65 | $42,950 | $180,398 | $119,246 |
| 10 | Maine | $20.56 | $42,760 | $179,612 | $118,460 |
| 11 | Colorado | $20.37 | $42,380 | $177,952 | $116,800 |
| 12 | Rhode Island | $20.35 | $42,330 | $177,778 | $116,626 |
| 13 | Oregon | $20.21 | $42,040 | $176,555 | $115,403 |
| 14 | Wisconsin | $19.68 | $40,940 | $171,924 | $110,772 |
| 15 | North Dakota | $19.61 | $40,790 | $171,313 | $110,161 |
| 16 | Maryland | $19.34 | $40,230 | $168,954 | $107,802 |
| 17 | Arizona | $19.28 | $40,100 | $168,430 | $107,278 |
| 18 | Illinois | $19.00 | $39,520 | $165,984 | $104,832 |
| 19 | New Hampshire | $18.85 | $39,210 | $164,674 | $103,522 |
| 20 | Vermont | $18.74 | $38,980 | $163,713 | $102,561 |
| 21 | Minnesota | $18.63 | $38,750 | $162,752 | $101,600 |
| 22 | Wyoming | $18.55 | $38,580 | $162,053 | $100,901 |
| 23 | Nevada | $18.51 | $38,500 | $161,703 | $100,551 |
| 24 | Michigan | $18.50 | $38,480 | $161,616 | $100,464 |
| 25 | South Dakota | $18.47 | $38,420 | $161,354 | $100,202 |
| 26 | Nebraska | $18.43 | $38,330 | $161,004 | $99,852 |
| 27 | Delaware | $18.34 | $38,160 | $160,218 | $99,066 |
| 28 | Virginia | $18.32 | $38,100 | $160,044 | $98,892 |
| 29 | Montana | $18.28 | $38,020 | $159,694 | $98,542 |
| 30 | Florida | $18.13 | $37,720 | $158,384 | $97,232 |
| 31 | Idaho | $18.07 | $37,580 | $157,860 | $96,708 |
| 32 | Iowa | $18.00 | $37,440 | $157,248 | $96,096 |
| 33 | Utah | $17.94 | $37,320 | $156,724 | $95,572 |
| 34 | Missouri | $17.81 | $37,040 | $155,588 | $94,436 |
| 35 | Pennsylvania | $17.78 | $36,980 | $155,326 | $94,174 |
| 36 | Indiana | $17.45 | $36,300 | $152,443 | $91,291 |
| 37 | Georgia | $17.38 | $36,150 | $151,832 | $90,680 |
| 38 | Kansas | $17.36 | $36,110 | $151,657 | $90,505 |
| 39 | Ohio | $17.32 | $36,030 | $151,308 | $90,156 |
| 40 | Texas | $17.17 | $35,720 | $149,997 | $88,845 |
| 41 | North Carolina | $17.04 | $35,450 | $148,861 | $87,709 |
| 42 | South Carolina | $16.99 | $35,330 | $148,425 | $87,273 |
| 43 | Tennessee | $16.98 | $35,310 | $148,337 | $87,185 |
| 44 | New Mexico | $16.90 | $35,150 | $147,638 | $86,486 |
| 45 | Arkansas | $16.75 | $34,850 | $146,328 | $85,176 |
| 46 | Oklahoma | $16.35 | $34,000 | $142,834 | $81,682 |
| 47 | Kentucky | $16.23 | $33,760 | $141,785 | $80,633 |
| 48 | West Virginia | $15.85 | $32,960 | $138,466 | $77,314 |
| 49 | Louisiana | $15.77 | $32,800 | $137,767 | $76,615 |
| 50 | Alabama | $15.65 | $32,560 | $136,718 | $75,566 |
| 51 | Mississippi | $15.46 | $32,160 | $135,059 | $73,907 |
Hourly and annual wages are BLS May 2025 mean estimates for Receptionists and Information Clerks (SOC 43-4171). The 24/7 column multiplies the hourly wage by 8,736 hours. Figures are rounded to the nearest dollar.
What This Means for Your Business
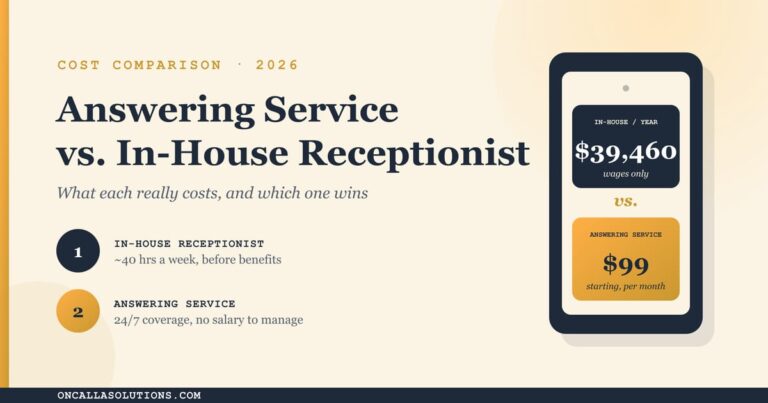
Few small businesses actually need a staffed phone line 168 hours a week. The point of the ranking is the scale: staffing every hour costs several multiples of a single receptionist’s salary in every state, which is why many businesses cover the gaps — nights, weekends, lunch, and overflow — with an answering service rather than more hires. If you only need to cover part of the week, our answering service vs. in-house receptionist comparison walks through the numbers for a single full-time receptionist. You can also estimate what unanswered calls cost you with our free missed call cost calculator, or see the full virtual receptionist cost breakdown.
Cite or Share This Ranking
If you reference this data in an article, report, or newsletter, please link to this page. Suggested citation:
OnCalla Solutions. “What Does 24/7 Phone Coverage Cost In-House? A State-by-State Ranking (2026).” https://oncallasolutions.com/blog/in-house-phone-coverage-cost-by-state/ (data: U.S. Bureau of Labor Statistics, May 2025).
Questions about the method or a figure? Email sales@oncallasolutions.com.
Frequently Asked Questions
How much does it cost to staff a phone line 24/7 in-house?
About $165,722 a year in wages at the national average, ranging from about $135,059 in Mississippi to $193,590 in California. That covers roughly 4.2 full-time receptionists and excludes taxes, benefits, and overnight pay differentials.
Which state pays receptionists the most?
Washington, D.C. has the highest average at $24.26 an hour ($50,450 a year), followed by California ($22.16), Washington ($21.97), New York ($21.56).
Where does this wage data come from?
The U.S. Bureau of Labor Statistics Occupational Employment and Wage Statistics program, May 2025 estimates for Receptionists and Information Clerks (SOC 43-4171), available at bls.gov/oes. The national figure is $18.97 an hour, or $39,460 a year, across about 910,000 workers.
Does an answering service really cost less than hiring?
For phone coverage, generally yes: OnCalla’s shared plans start at $99 a month and dedicated agents start at $7 an hour. An in-house hire is the better fit when you need someone physically present. Many businesses use both.
Wage figures are averages and vary by employer, city, and experience. This page is for general information and is not financial or legal advice.